Research spotlights

Nature Communications · 2026

One changing climate, different futures for mammals

A warmer world does not push every species in the same direction. A temperature increase that makes one region less suitable may ease a constraint elsewhere. A map of future habitat alone cannot show which environmental changes are behind those contrasting outcomes.

We used explainable artificial intelligence to look inside distribution models for 1,992 terrestrial mammals. By separating the contributions of climate and land cover, we tracked where individual drivers became more or less favorable, including places where their contribution switched direction.

The projections revealed a geography that global averages can hide. Temperature-related drivers dominated many patterns of risk and opportunity. Climate extremes produced intense but localized shifts, and range-restricted mammals faced greater projected temperature-related risks. The same driver could become less favorable in one region and more favorable in another.

These projections can help planners consider which environmental pressures are changing, as well as where. They explain model predictions without establishing cause and effect.
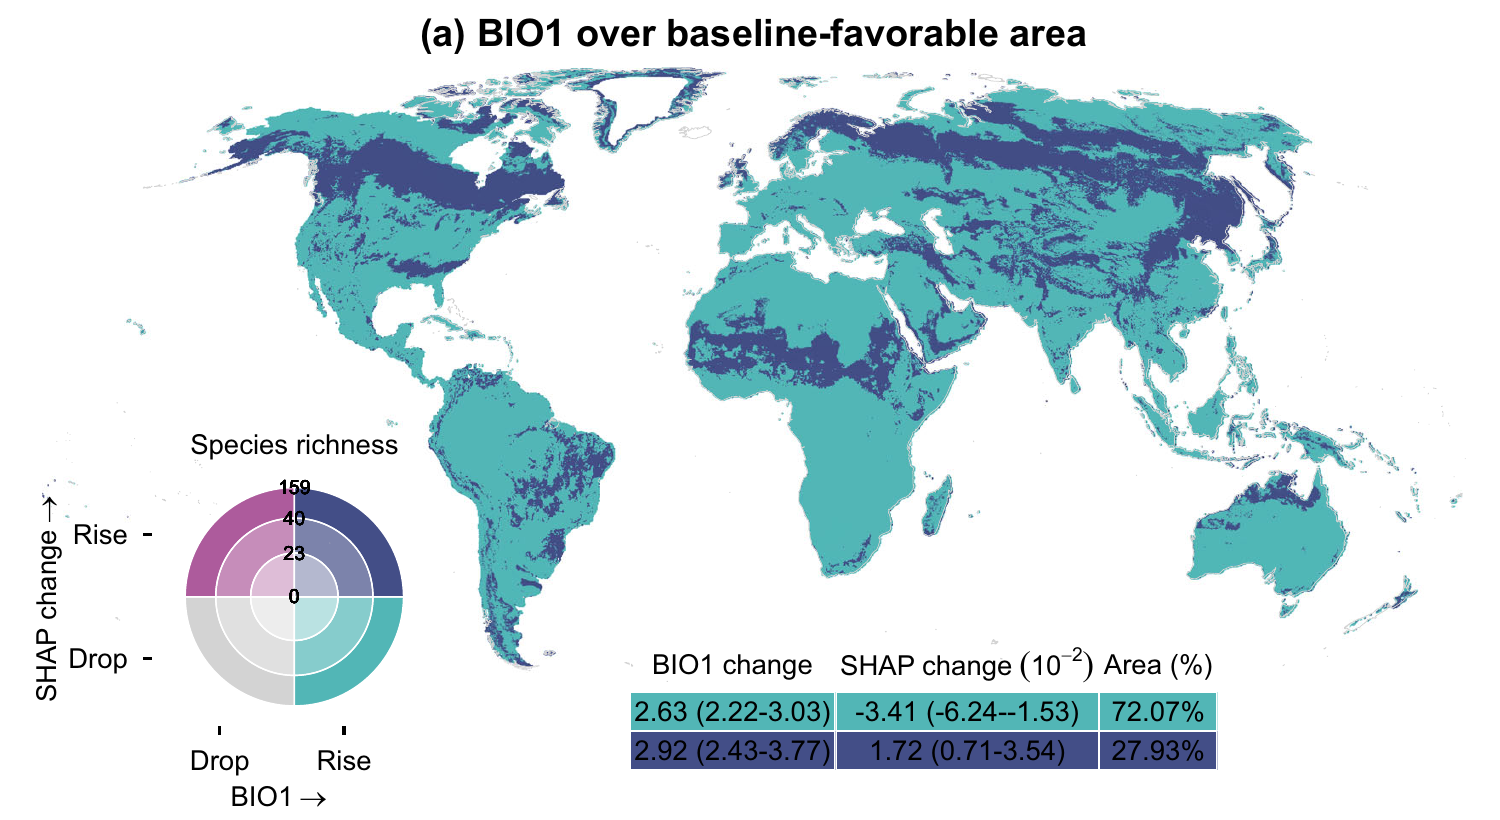
Published Figure 6a: regional differences in projected temperature-related favorability shifts for mammals
Figure 6a. Temperature-related favorability shifts by mid-century (SSP370, 2041–2070). Panel excerpt; CC BY 4.0.

Landscape Ecology · 2025

Finding room for food and wildlife in Tanzania

A productive field can be in the wrong place. In Tanzania, cropland expansion can help feed a growing population while disrupting routes between wildlife habitats. Choosing land by yield alone may therefore overlook what that field means for the landscape around it.

We asked where Tanzania could double production of five staple crops by 2050 with less ecological damage. Our planning model brought crop productivity together with market access, biodiversity, carbon storage and wildlife connectivity.

We found room for a better compromise. A plan balancing all five priorities required only 2.6% more land than a yield-only plan, while reducing modeled connectivity loss by 27.5%. The food production target stayed the same; the ecological consequences of reaching it changed.

The study also turns attention back to the fields already there. Scenarios that used existing farmland more fully or changed the crop mix reduced the need to expand. Before asking where the next field should go, planners have another opportunity to consider: how much expansion could better use of today’s farmland avoid?

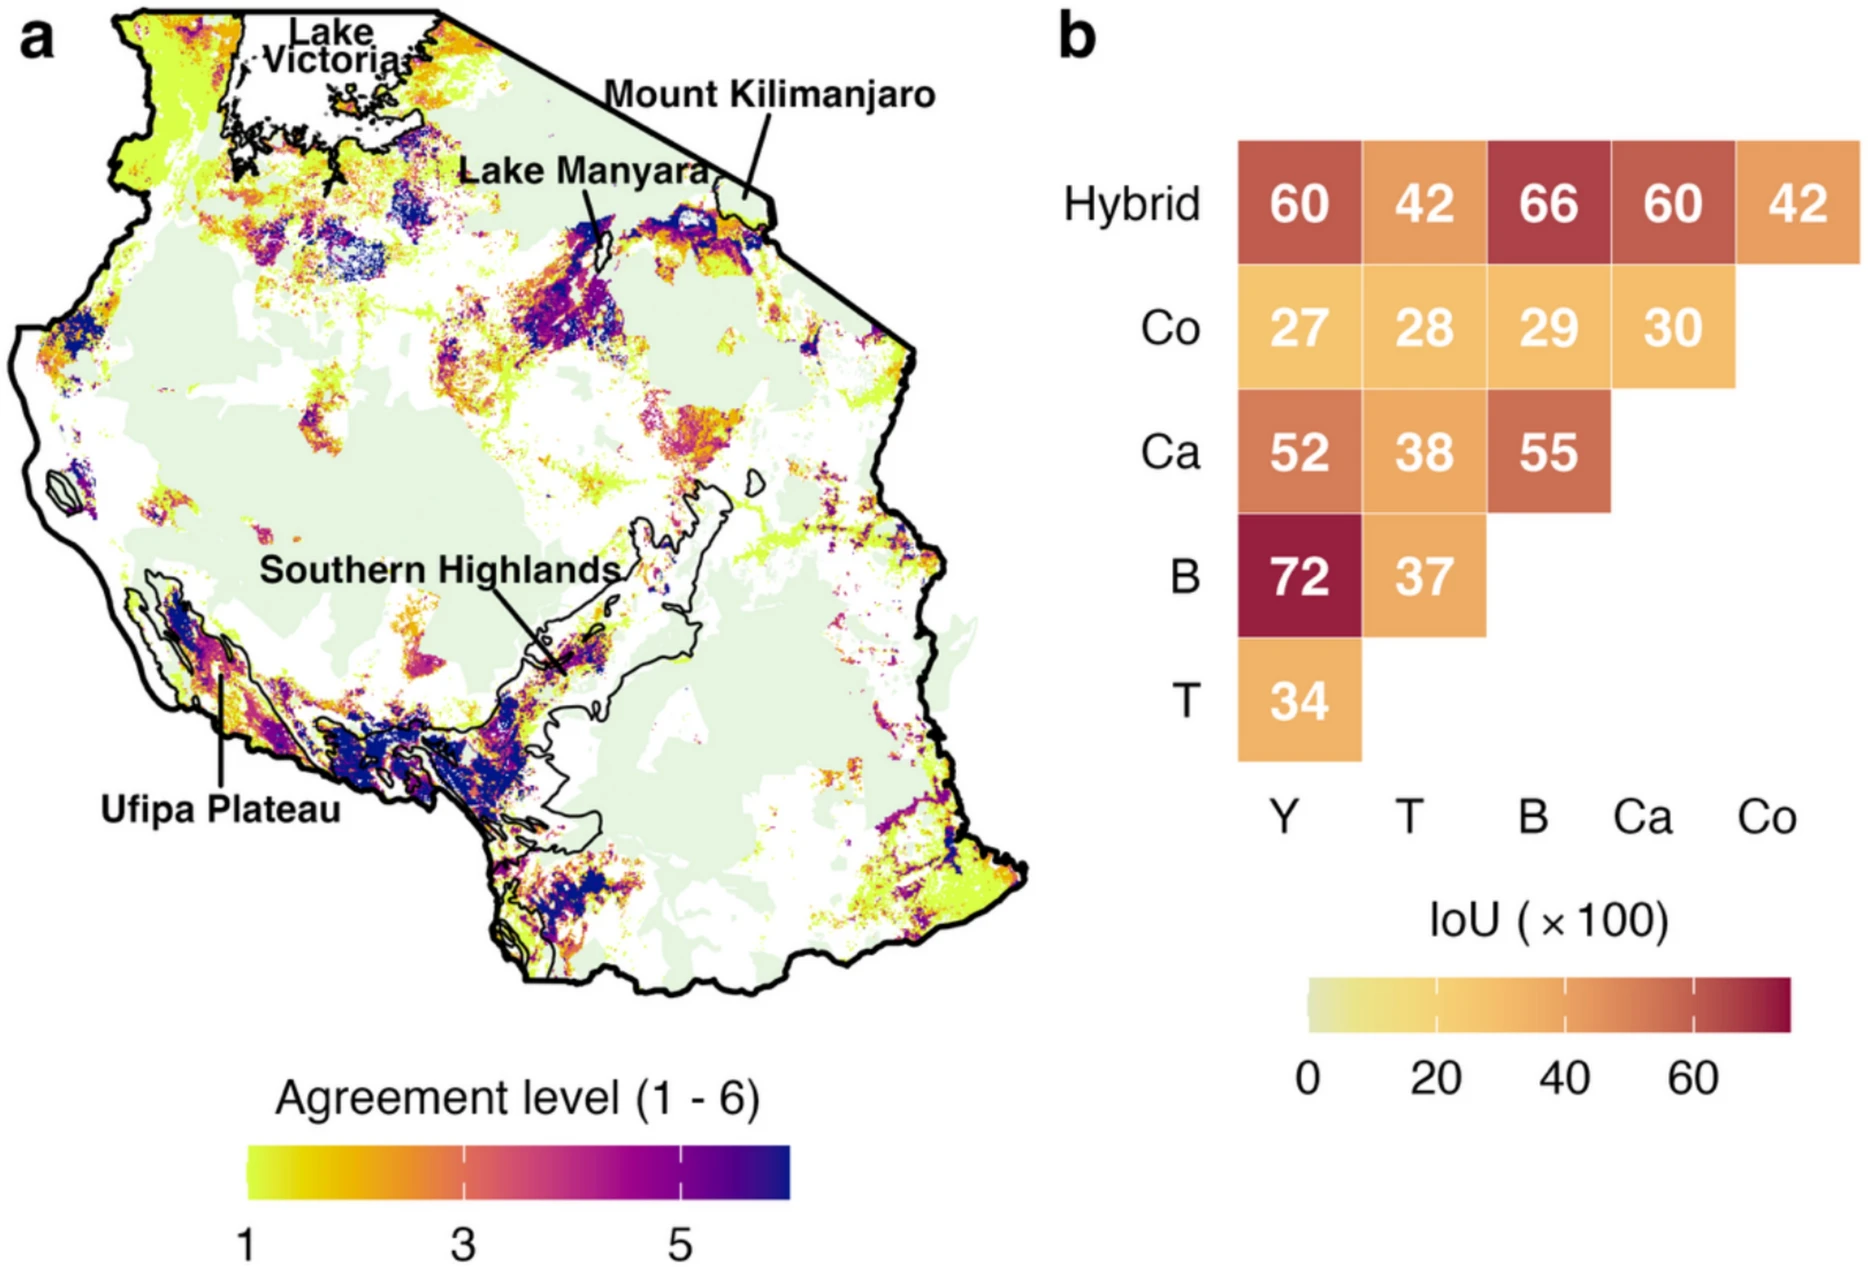
Published Figure 4: a Tanzania map and matrix showing agreement among alternative cropland allocation plans
Figure 4. Agreement among cropland plans with different priorities. Pale green marks protected areas. Reproduced under CC BY 4.0.

Ecological Modelling · 2025

Keeping Tanzania’s elephant habitats connected

An elephant can live inside a protected area and still depend on land beyond its boundary. Food, water and other herds may lie across a landscape divided by farms and settlements. Protecting habitat patches alone leaves the connections between them exposed.

We set out to find those connections across Tanzania, despite uneven observations. We combined expert range maps with precise occurrence records, built habitat models at different scales, and used the resulting suitability map to simulate landscape connectivity.

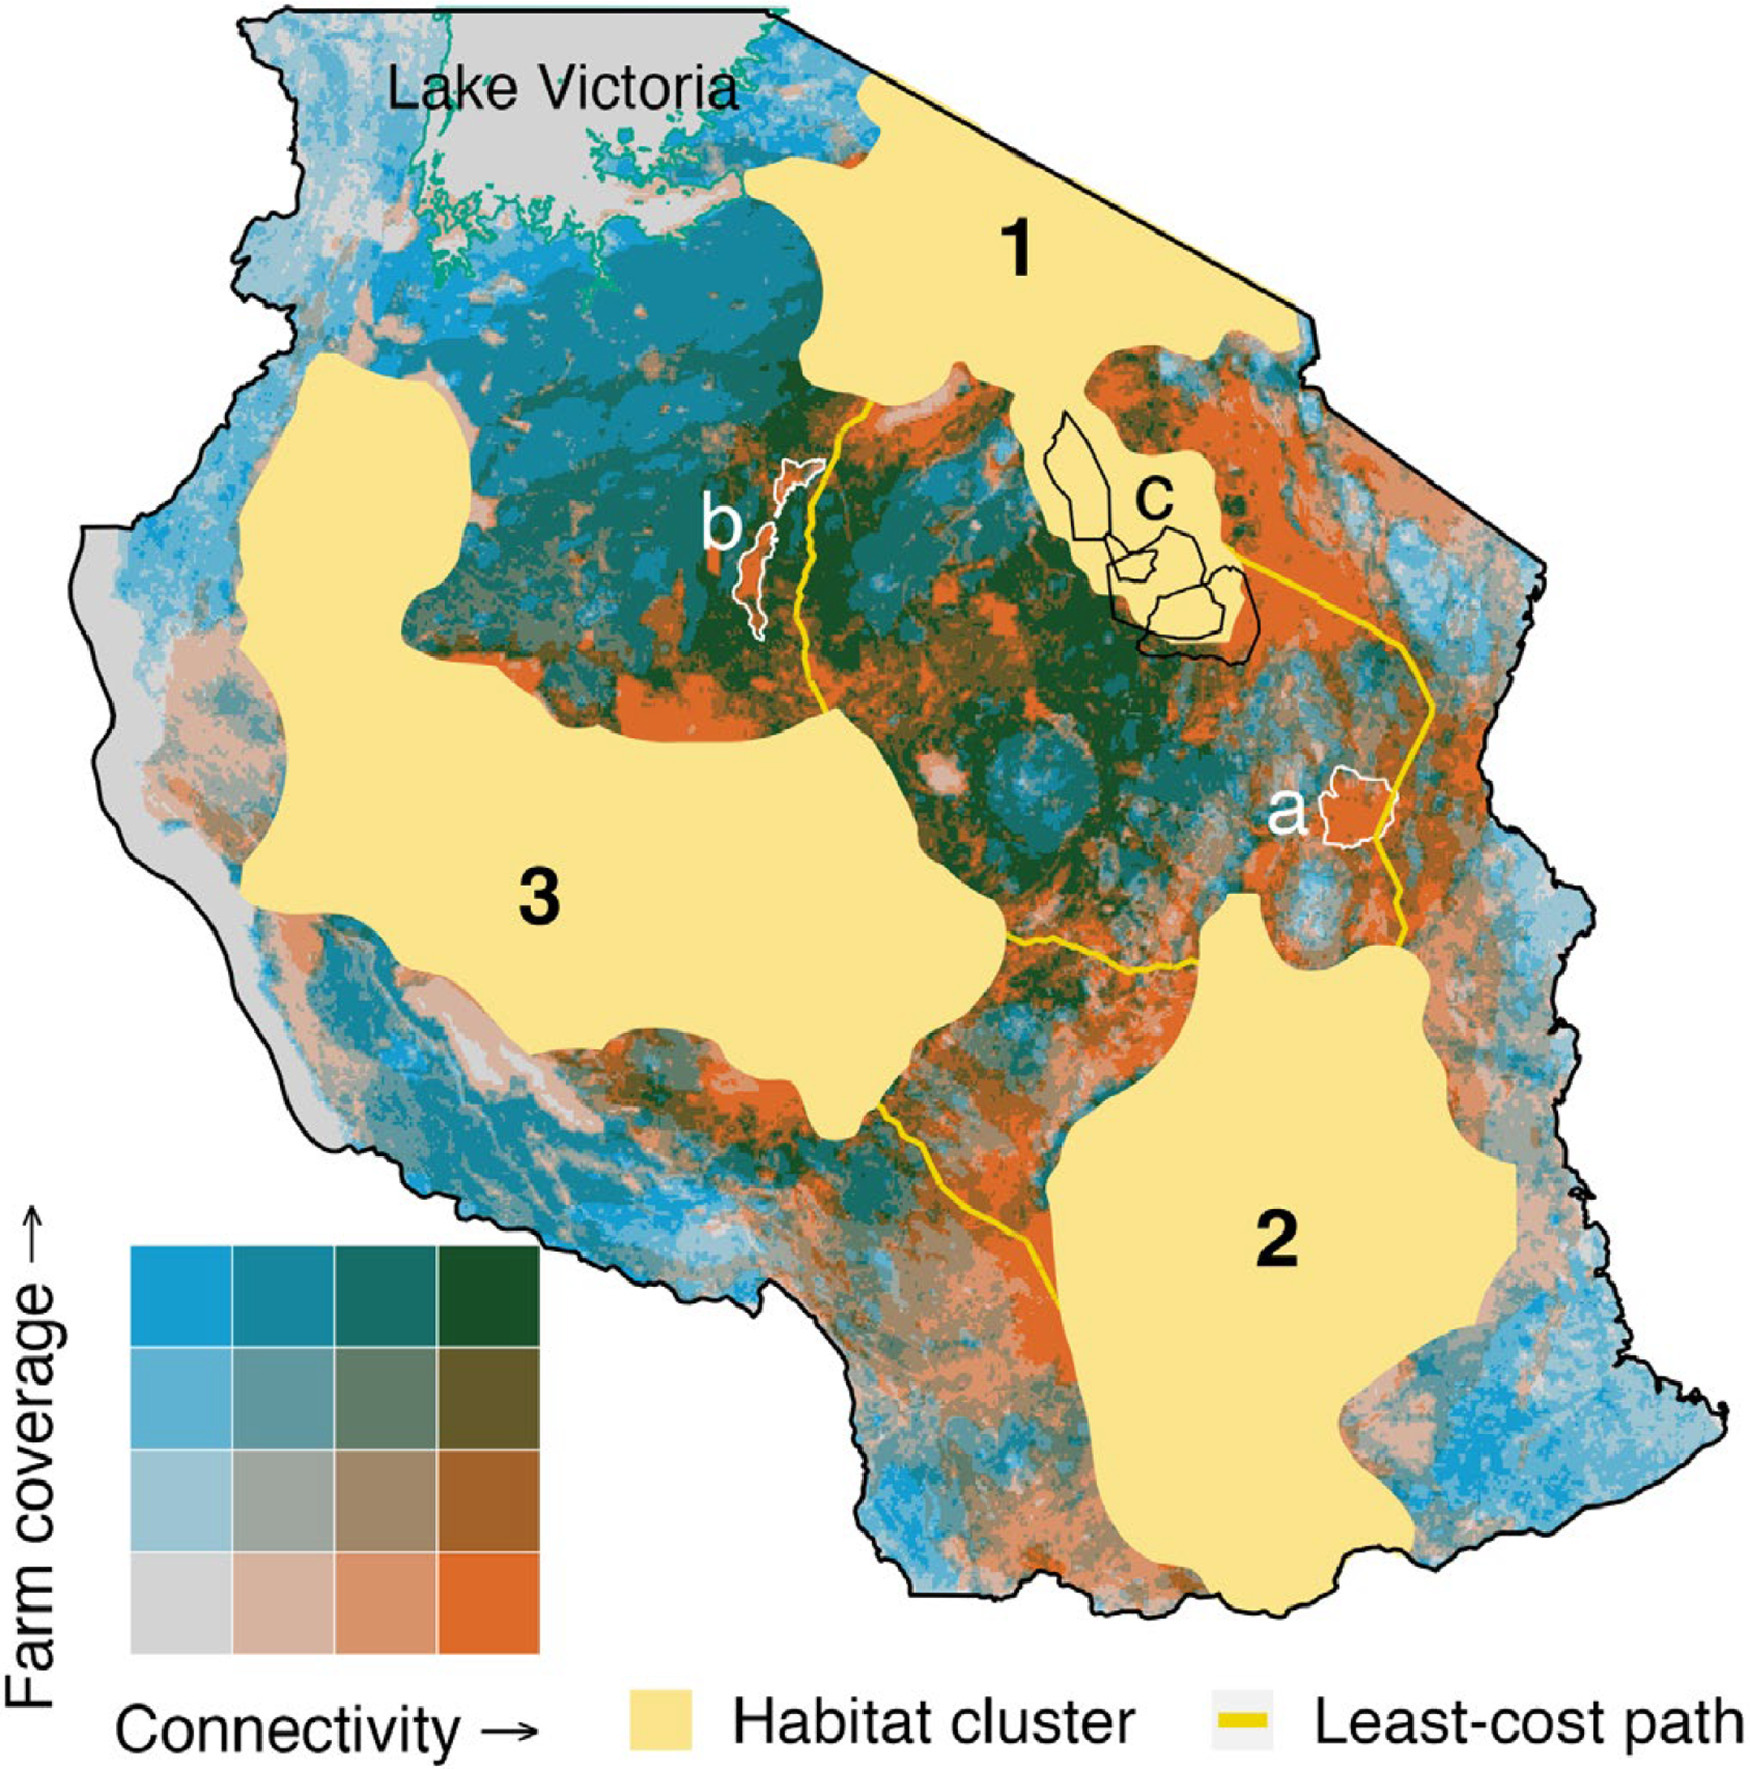
The analysis identified potential links among three major habitat clusters, alongside places where important connections overlapped cultivation. Around Lake Kitangiri and the southern Tarangire landscape, modeled links highlighted pressure points where agriculture could put connectivity at risk. The maps suggest candidate linkage zones, rather than confirmed elephant tracks.

The result shifts attention from isolated protected areas to the land that holds them together. It offers a way to target field surveys, corridor protection and land-use planning where they could help keep elephant populations connected.

Published Figure 6: Tanzania map showing modeled elephant connectivity overlapping cropland between three habitat clusters
Figure 6. Modeled elephant connections overlap cropland across Tanzania. Reproduced under CC BY 4.0.